Using real-world data from our Covid-19 telehealth assessment, we were able to simulate the potential impact of our online visit and consultation, especially when it is implemented early and adopted widely.
In March, Ro launched the first free COVID-19 telehealth assessment available nationwide. Since then, Ro has helped patients in every state plus Washington, DC as well as more than 70 companies and organizations with our free assessment. With more COVID-19 virtual assessments and in-person care services now available, Ro has turned our focus to the greatest patient need at this time: providing accurate, up-to-date health information on Ro’s COVID-19 Resource Hub. As part of this transition, Ro’s Coronavirus Telehealth Assessment is no longer live as of October 1, 2020.
Key learnings:
Ro recently launched an online assessment and consultation service for patients who are concerned they have contracted Covid-19. We analyzed a small slice of early data to try to understand the impact of this service.
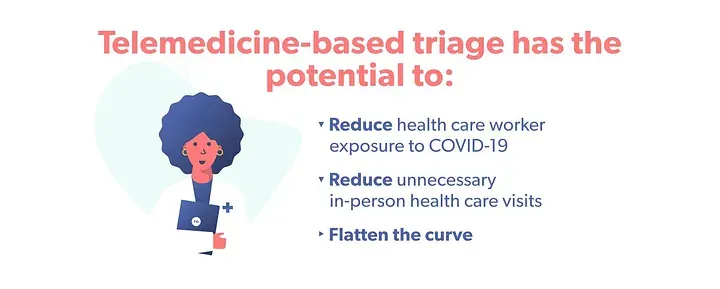
We broke down the assessment and consultation outcomes and simulated the possible real-world implications. Under certain conditions, we found that telehealth has the potential to:
Reduce health care worker exposure to Covid-19
Reduce unnecessary in-person health care visits
Flatten the curve
This data is limited. We cannot understand the full health care journey of the patient until we find a way to connect telehealth to the larger health care system.
A few weeks ago, Ro launched a Covid-19 online assessment and consultation that is now available to patients across the U.S. at no cost. We did this for several reasons:
To increase access to care for everyone that is concerned about Covid-19
To help people with symptoms or risk factors decide, in consultation with a health care provider, the appropriate level of care
To protect health care resources and front-line workers so they are available for those that need them the most
To combat misinformation online by providing a comprehensive resource hub with scientifically and medically vetted information on Covid-19
The visit is designed as a funnel that connects the right patients to the right resources, reserving in-person care only for the patients who need it.
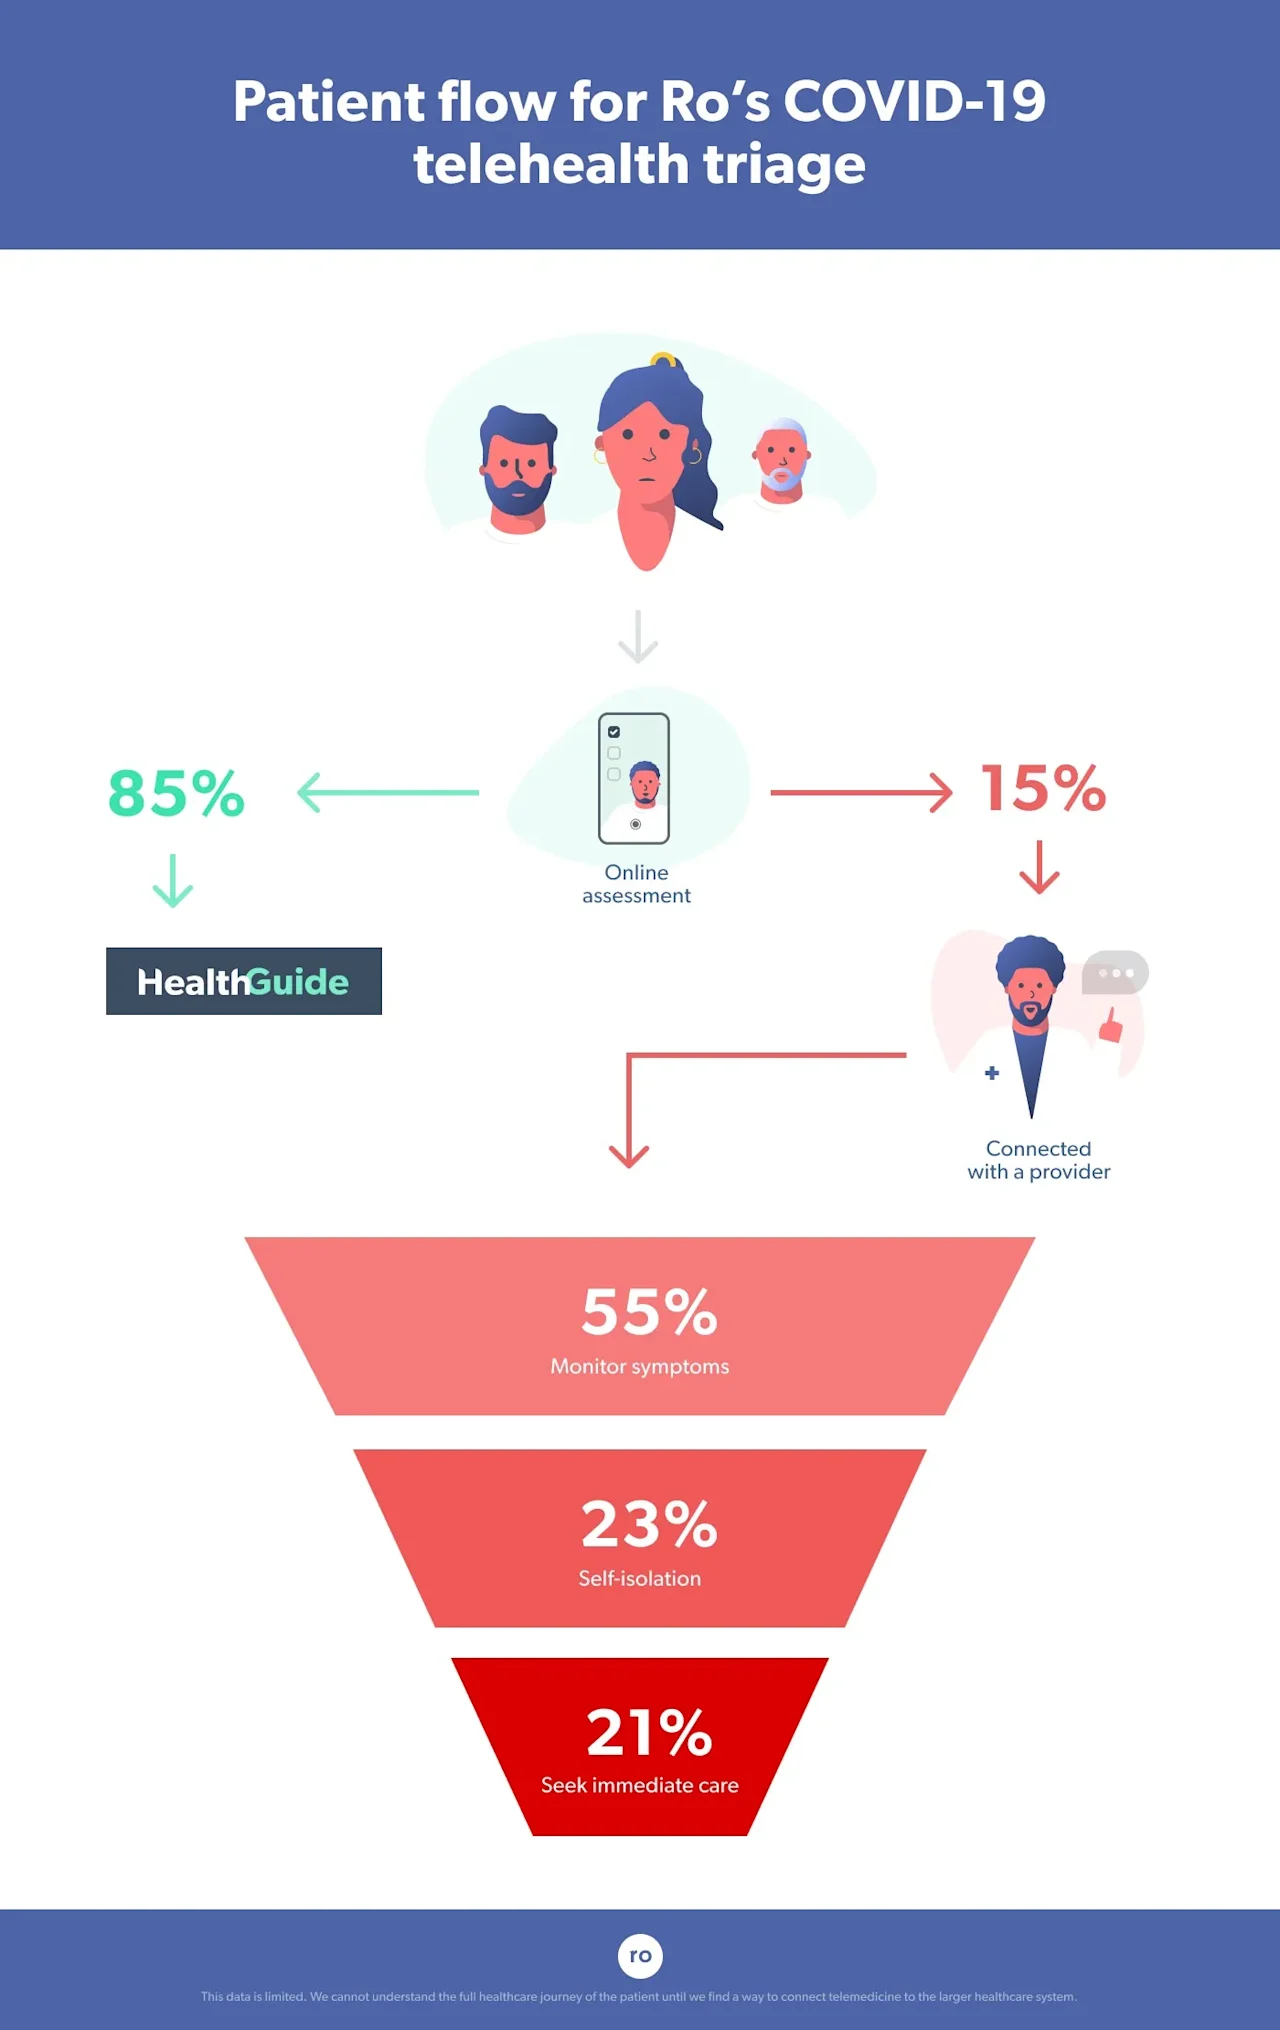
Our multidisciplinary team of doctors (including infectious disease experts) and other stakeholders designed the online assessment and consultation service based on U.S. Centers for Disease Control and Prevention (CDC) guidance. This resource serves as a funnel to risk-stratify patients for likelihood of Covid-19 and counsel them on appropriate next steps. Patients answer a series of questions in an online assessment about relevant factors such as age, geographic location, contact with known Covid-19 patients, symptoms, and health history.
Patients who do not report any risk factors or symptoms suspicious for Covid-19 are automatically directed to a resource hub with up-to-date information on the disease and best practices for preventing spread. This represents the widest part of the funnel, and this filter helps to protect the availability of virtual providers, who are a finite resource just like their in-person counterparts.
The second part of the funnel is for patients who report relevant symptoms and/or risk factors. They are connected with a Ro-affiliated, U.S. licensed provider. The provider reviews the patient’s online assessment ahead of time and, during the consultation, collects more specific or clarifying information when necessary. Providers then use CDC guidance in conjunction with their clinical judgment to help patients decide on best next steps for that individual.
We conducted a small case study using early data to assess the rates of assessment and consultation outcomes, and what the impact on our health system might be.
This is an unprecedented moment, so we have no historical data to guide our expectations on what the outcomes of an online assessment and consultation in a pandemic should be. General statistics on Covid-19 are changing dramatically from day to day and place to place. We are seeing these swings in our data too. Like everyone else, we won’t truly be able to nail down trends or assess our impact until the “fog of war” has cleared.
We are also limited in our ability to understand the full patient journey. We (Ro) are a part of this response system because we have the tools to help patients decide what kind of care they need. But currently, there isn’t an easy way to integrate into the greater system to share the data we have and get data in return — including what ultimately happened to the patients we helped after they left Ro. Our hope is to be able to do that in the near future as telehealth becomes an increasingly important part of the health care response to Covid-19 and our national health care needs writ large.
However, we can identify some early patterns that may potentially help inform current and future solutions. We know that over time these numbers might change, but a preliminary analysis offers a glimpse into telehealth’s potential benefits and the role it will continue to play as the disease spreads.
To start, we broke down the top of the funnel: we looked at what percentage of patients ended up at the resource hub (lower risk) versus those that were connected to a Ro-affiliated provider (medium to higher risk).
Using data collected from patients during the first few weeks our assessment was available, we compared the proportion of people that were directed to our resource hub versus those that were connected to a Ro-affiliated provider.
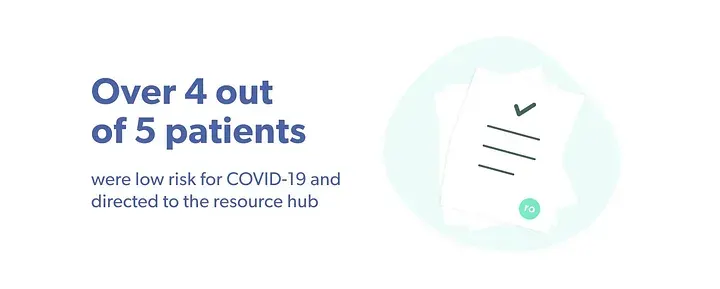
More than 85% of patients who completed the assessment were directed to the resource hub. That suggests the funnel is doing what we wanted it to do.
The majority (~85%, or a little over 4 out of 5) of patients who completed the assessment during this time bracket were categorized as low risk for Covid-19 based on risk factors defined by the CDC. This means that they had no symptoms and no known epidemiologic-based risk factors (e.g. they had not travelled to any countries listed by the CDC at that time as places with known community spread or had contact with anyone with Covid-19 symptoms). These patients were directed to the resource hub.
Because the intent of this tool was to safely and efficiently counsel patients to a shared decision on the best next level of care, follow-up on what these patients did next (or if they ever intended to get in-person care in the first place) was limited. However, we optimistically believe that completing our online visit and being reassured that they were at low risk might have prevented at least some people from going to see a doctor in person unnecessarily. This frees up an appointment for someone else who may require it and prevents unnecessary exposure in a waiting room.
Reducing waiting room exposure might be an important prevention strategy: One study found that spending time in emergency department waiting rooms is associated with an increased risk of contracting the flu. Everything we know about Covid-19 so far indicates that it might be more contagious than the flu (based on what we know about their respective reproduction numbers).
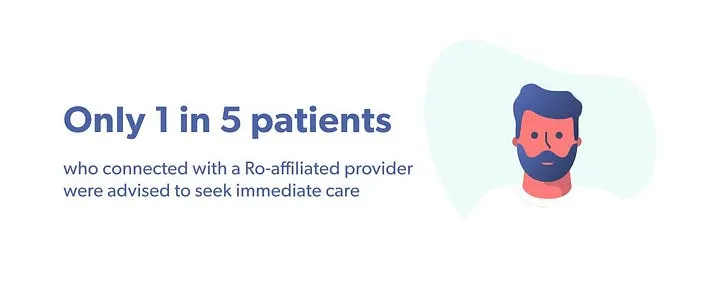
Next, we looked at what happened further down in the funnel to patients who connected with a Ro-affiliated provider: 1 in 5 were advised to seek further care.
We then analyzed outcome distributions in the second part of the funnel for the 15% of patients who were connected with a Ro-affiliated provider, who then helped patients decide what to do next. Here’s what happened with these patients within the Ro system:
Providers advised the majority of these patients (~55%) to be vigilant and monitor their symptoms and that, based on their assessment, self-isolation or in-person care was not necessary (though at minimum all patients were advised to follow recommendations for social distancing and general infection control and hygiene best practices in place at the time). For example, this might have been the outcome for a young and otherwise healthy person who developed a runny nose. Research shows a runny nose can be a Covid-19 symptom in a small proportion of patients, but in the absence of other, more common symptoms or known risk factors, the provider might have suspected that the patient has a cold or allergies.
Providers advised around a quarter of these patients (~25%) to self-isolate and monitor their symptoms, meaning they had symptoms and risk factors for Covid-19 and should take action to reduce spread but that in-person care was not recommended at the time. For example, this might have been the outcome for an otherwise young and healthy person with no symptoms who learned someone they interacted with a few days ago tested positive for the virus, or someone experiencing telling but mild symptoms.
Providers advised 21% of these patients to self-isolate and seek further care as soon as possible by calling a local, in-person provider. For example, this might have been the outcome for someone with symptoms of Covid-19, like a fever and persistent cough, and an underlying health condition, like diabetes, that puts them at risk for dangerous complications.
Using this data, we simulated the impact of early and widespread use of the assessment and consultation tool. We found that it has the potential to reduce up to 50% of health care worker exposure to Covid-19.
Before anything else, it’s important to acknowledge that our simulation rests on many assumptions.
To understand how Ro’s service can impact availability of health care resources and the spread of Covid-19, we simulated the best-case scenario impact in a hypothetical population of 1,000 patients living in a small, isolated town. For this analysis, we adopted several assumptions.
First, we assumed that everyone in the population completes the online assessment. In other words, there was complete adoption of the service.
Second, we assumed that people completed their online assessment early on, before community spread began and social distancing measures were implemented. The CDC defines the start of community spread as the point at which the virus is “spreading easily and sustainably in the community…including [to] some who are not sure how or where they became infected.” This matters for the next assumption.
Third, we assumed that everyone was funneled correctly. This means that every patient directed to the resource hub was not infected. This is where the previous assumption comes in: this can only occur in the early stages of the pandemic, before community spread. Because we know that many Covid-19 patients are asymptomatic, eventually there will be many people that are infected but have no symptoms or known risk factors. There is no way to identify these people without widespread testing and instruct them to self-isolate (and this is why we need social distancing). In other words, it assumes that assessment and consultation outcomes were accurate: everyone identified as low risk and directed to the resource hub was not infected, and everyone identified as medium or high risk and instructed to self-isolate was indeed infected with Covid-19 but did not need in-person care later on. We know this is unlikely to be true in all cases: in the absence of testing it can be challenging to distinguish Covid-19 from the flu, and our data tells us that providers often explicitly instructed many patients advised to self-isolate to get in-person care if symptoms got worse or did not abate over time.
Finally, we assumed that patients followed the instructions they were given and did not either decide to seek care anyway or to forgo self-isolation.
Our results are simulated and not generalizable, but they can still be valuable.
Of course, the perfect set of circumstances listed above would never manifest in real life. The simulation reveals the maximum, best-case scenario for positive impact of telehealth during a pandemic. It’s a worthwhile exercise because it is guided by early but real-world information on outcomes; it’s not a perfect model but the results are more than we knew yesterday. It also helps us identify what kind of information we need to collect to paint a more precise picture of the impact of telehealth assessment and consultation (e.g., structured follow up with patients to find out how completing this process affected their utilization of the in-person health care system).
This simulation also helps us set a benchmark for the highest possible positive impact an online assessment and consultation service can have in a public health crisis like this. When we have the data that allows us to more precisely measure our actual impact on the larger health care system, we can compare it to the “north star” numbers we are generating now. This provides valuable information on how Ro can improve our services in the future.
The first part of the simulation is simple: we plugged in our percentages.
We started the simulation by simply plugging our 1000-person population that all went through the online assessment into the model:
According to our data, 850 of them would be immediately classified as low risk and directed to our resource hub, where they would access information from public health officials and learn tips on how to stay healthy
150 of them would have had a telehealth consultation with a Ro-affiliated provider
84 of them would have been told to monitor their symptoms, because while they might not be feeling completely healthy, it’s unlikely they were infected by Covid-19
35 of them would have had some combination of risk factors and/or symptoms such that an asymptomatic or mild case of Covid-19 could not be ruled out, and would have been told to self-isolate
30 of them would been recommended to see a doctor in person because of suspected Covid-19 and severe symptoms and/or concern about complications due to risk factors like underlying conditions
What does this mean? If the 84 people advised to monitor symptoms and the 35 people advised to self-isolate were effectively deterred from seeking in-person care that they otherwise would have sought, then in-person health care traffic could be reduced by almost 80%, making space for the 30 people who need it.
If any of the 65 people with Covid-19-related symptoms leave their homes to seek care, they could expose other people to the virus, including the health care workers who treat them. But, if the 35 infected people advised to self-isolate decide to do so and recover on their own without seeking in-person care (when they otherwise would have), health care worker exposure by infected persons could be reduced by over 50%.
The second part of the simulation applies an epidemiological model of disease spread.
We wanted to roughly estimate how Covid-19 would spread in our hypothetical small town if the 35 infected-but-mild patients agreed to isolate versus if they were never advised to and thus did not self-initiate isolation. There are many modeling approaches that can be executed by highly-trained epidemiologists that can also account for variables like self-isolation in a sophisticated way. To be clear, this is not one of those models. It’s what’s known as a basic SEIR model (SEIR stands for susceptible, exposed, infected, and recovered), and the analysis was done by a PhD-level research scientist with a background in statistics but no formal training in epidemiology. In the interest of transparency, here’s how we did it (and you can review the full code here):
We used the EpiModel package in R to run this part of the simulation. First, we had to input some important numbers so that the model could mimic the spread of Covid-19 in the most accurate way possible. We relied on published research to guide these inputs, including 2% as the case fatality rate and 2.28 as the reproduction number.
The other set of inputs are the number of people in the population that are susceptible to the virus, have been exposed to the virus, have been infected by the virus, and have recovered from the virus. We took these numbers from the first part of our simulation. We first modeled the spread of Covid-19 in our hypothetical population assuming that the 35 suspected positive cases had not been identified and isolated. This means we classified 65 people as infected and 0 people as recovered, since we assumed that it was early on in the outbreak. We included one additional assumption: that before taking the online assessment, each infected person had exposed one other person in the population. The rest of the population is classified as susceptible; these are the healthy individuals.
We then reran the model shifting our 35 patients with suspected Covid-19 that were told to self-isolate from the infected group into the recovered group so they were no longer infecting other susceptible individuals. However, we still assumed that each patient exposed one person before they consulted with a provider and decided to self-isolate. Of course, this is not the true chronological order: they would not recover instantaneously, but we assume they would recover eventually.
We used four months as the time frame of spread.
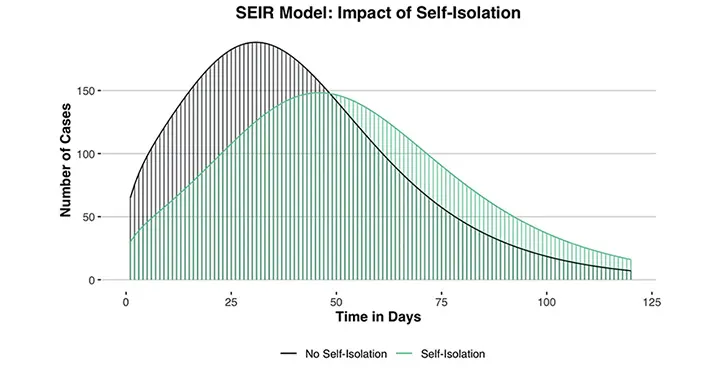
Here’s what we found: when the 35 suspected infected cases are not counseled on isolation and do not self-initiate reducing all contact, the number of total cases peaks on day 31 at 186.8. When the 35 suspected infected cases are removed from the infectious pool because they self-isolate, the number of cases peaks at 146.6 on day 46.
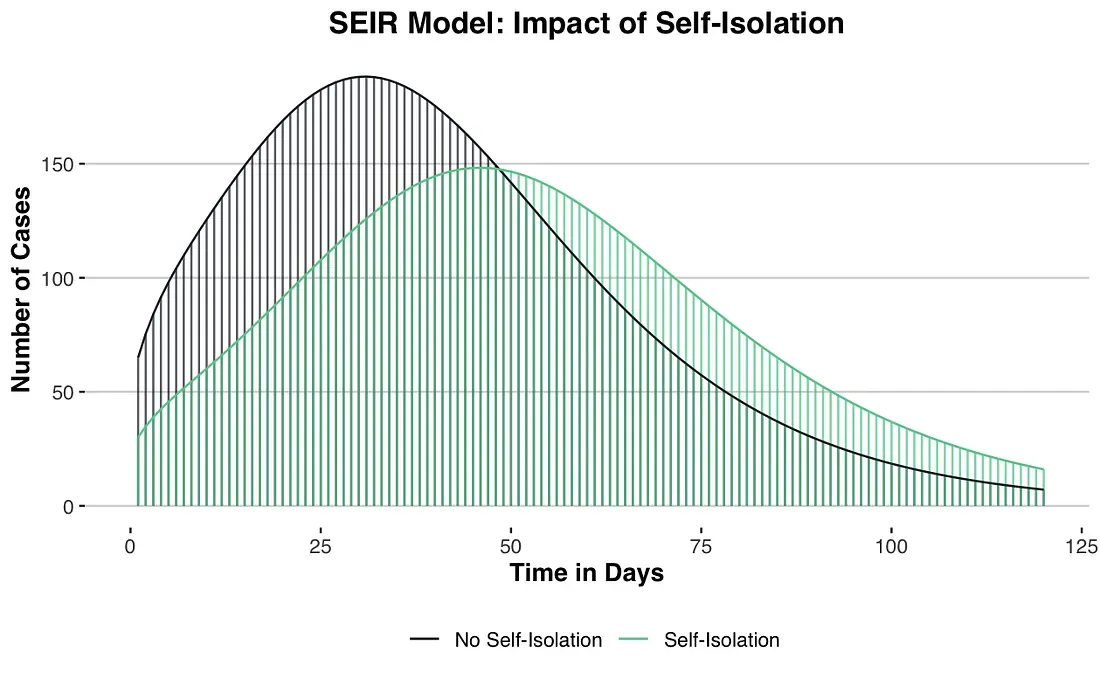
This is only a simulation based on a limited dataset
According to our rough model, the online assessment and consultation service extended the time until peak number of infections in our hypothetical town by around 48% (from 31 to 46 days) and reduced the peak number of infections by around 20% (from 187 to 147). The combined effect of reducing the peak number of infections and extending the amount of time until that peak occurs is known as “flattening the curve.” While the benefit of reducing the number of infections is obvious, the delay is a crucial factor: it buys us time to prepare and helps prevent the health care system from being overwhelmed.
In a population of 1,000 people, the estimated number of peak infections is reduced by around 40.2 when consultation-directed self-isolation occurs. Multiplication demonstrates how this estimation changes if we assume a larger population.
If the population is increased to:
10,000: the estimated number of peak infections is reduced by 420
100,000: the estimated number of peak infections is reduced by 4,200
1,000,000: the estimated number of peak infections is reduced by 42,000
This is simple math, but it demonstrates that more widespread use of telehealth has the potential to translate to significant impact on individual lives.
Conclusion
We know that telehealth is limited in certain ways: the information provided by the online assessment and consultation with patients offer a lot of pieces of the diagnostic puzzle, but there are a few steps providers can’t take, like listening to people’s lungs with a stethoscope or testing a patient for Covid-19.
We also know that the numbers we are presenting from this case study are far from perfect and mostly hypothetical. But we are excited by the possibility that, even on a much smaller scale than what our simulation suggests, we are doing something to help slow the spread, protect health care workers and resources, and encourage people who really need to be seen in person to do so. Right now, every little bit counts.
Getting this pandemic under control requires so much more than telehealth assessments. But now and going forward it’s clear that telehealth is an effective tool that needs to be included in our collective toolbelt.
