Here's what we'll cover
Here's what we'll cover
Here's what we'll cover
Getting pregnant isn’t always a simple process. For many women, it takes time—and a lot of patience. If you’ve recently started trying to conceive, when you try can be just as important as how often you try.
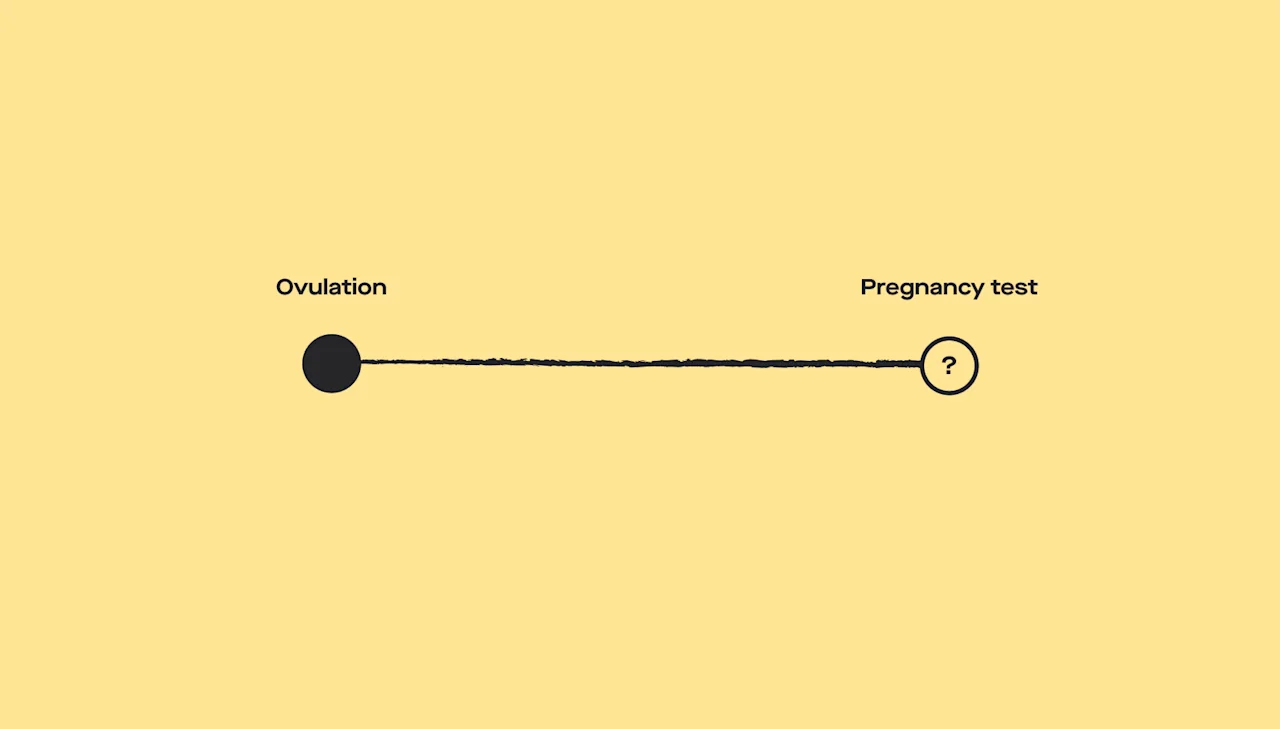
You have the highest chance of getting pregnant two to three days before you ovulate (the moment your ovaries release an egg that can potentially be fertilized by sperm). But how are you supposed to know when ovulation occurs? One thing you can try is tracking your basal body temperature or BBT (Peters, 2021).
Millions of women around the globe track their basal body temperature to zero in on their most fertile days. A slight increase in basal body temperature can be a sign that ovulation has occurred.
Though charting BBT for natural family planning is popular, it’s not always accurate and doesn’t work for all women. Still, it can help you establish a pattern of ovulation that may show the days you are most likely to get pregnant (Steward, 2021).
Ready to learn a bit more? Here’s a deeper dive into how it works.
What is basal body temperature (BBT)?
Basal body temperature—often called BBT—is your body’s temperature when you are resting. Basal body temperature tracking is a form of natural family planning that some women use to track when they are most fertile.
An average person’s BBT is between 97.0 and 98.0 Fahrenheit. These numbers dip a little bit just before your ovary releases an egg (this is when you’re most fertile) and increase slightly—by only about 0.5 to 1 degree—when you ovulate.
This temperature increase lasts until the start of your next menstrual cycle, and if your BBT stays elevated, it may be a sign of pregnancy (Peters, 2021; Steward, 2021).
How do I track my basal body temperature?
First, daily BBT readings for a few months are required to create a chart. This is important because you’ll need to see patterns of body temperature changes to better understand when you may be most fertile. Here are the steps to accurately chart your basal body temperature:
Choose the right thermometer
If you have a thermometer with units from 96 to 100 degrees and gives readings to the tenth of a degree (0.1°F) this is precise enough to measure your BBT. This can be a traditional glass thermometer, a digital thermometer, or a special thermometer designed to track basal body temperature (Steward, 2021).
You can use some basal thermometers with ovulation tracking apps. Some come with kits that include materials for measuring and charting your BBT. There are also wearable underarm, wrist, and ear technologies that take temperatures throughout a 24-hour period (Steward, 2021; Zhu, 2021).
Most importantly, you stay consistent and use the same thermometer—and take your temperature the same way—daily (Su, 2017).
Take your BBT at the same time each day
To get an accurate reading, take your temperature at about the same time each morning under your tongue (within 30 minutes). It’s important to take the reading when you first wake up and before you get out of bed, drink, eat, shower, or even talk. This is because any activity can lead to a rise in body temperature.
It’s also important to have had at least three–but, ideally, five—hours of uninterrupted sleep (Su, 2017).
Chart your BBT
Recording your daily BBT can be as simple as jotting it down on a piece of paper. You can also use an app and plug your information directly into your phone. Some specialized BBT thermometers will sync up with a smartphone app and automatically upload your daily temperature readings.
Whichever method you choose, the goal is to compare daily temperatures and watch for patterns. A temperature rise of even less than a 0.5°F that remains elevated for three days or more may be a sign of ovulation (Steward, 2021; Su, 2017).
Using your basal body temperature chart
If you’ve charted your basal body temperature for several months, and you’ve seen a pattern emerge, it may help you figure out when you’ve ovulated and when you’re likely to ovulate next. Knowing this can be helpful in answering the following questions:
When am I most likely to become pregnant?
The fertility window is the day an egg is released from the ovary, and up to five days beforehand—because this is the lifespan of sperm. A rise in BBT is a sign the body has already ovulated, so a single reading doesn’t help predict the best time for sex if you’re trying to get pregnant. However, charting your BBT for a few months may help you identify the most likely time of ovulation if your cycles are regular (Su, 2017).
For example, if after months of tracking, you’ve determined that you usually ovulate on the 14th day of your cycle, you’re most likely to become pregnant if you have sex a few days beforehand.
When am I least likely to become pregnant?
Since the egg released during ovulation dies after about 24–48 hours, avoiding sex until four days after ovulation may help prevent pregnancy. The least fertile times of a woman’s cycle are after the egg is no longer viable until the start of the next menstrual cycle (Su, 2017).
Keep in mind that your cycle can change, making it hard to know when you are ovulating. So, while BBT charts can help women avoid sex during their most fertile days, don’t rely on this if you’re not trying to get pregnant. Proven contraception methods are better ways to prevent pregnancy (Peters, 2021).
Is basal body temperature tracking reliable?
The drawback of using basal body temperature to track ovulation is that a lot of conditions can cause temperatures to vary. Fevers, stress, poor sleep, a change in room temperature, medications, birth control, breastfeeding, and even jet lag can change your BBT.
Many women also do not ovulate regularly, which can also make it difficult to track. For example, if you’ve recently stopped taking birth control, had a contraceptive device removed, or have a medical condition like polycystic ovary syndrome (PCOS), your ovulation patterns can vary (Goeckenjan, 2020).
There are other times when charting BBT may not be effective. Women with irregular menstrual cycles may not find BBT charting useful. Even if your menstrual cycles are fairly regular, they can change if you’ve recently given birth, are breastfeeding, or are approaching menopause (Manhart, 2018).
Combining fertility awareness methods
The gold standard to show when ovulation takes place is an ultrasound performed by a healthcare provider (Su, 2017). However, this is not practical for most women with the exception of sorting out more complex medical issues.
To better predict ovulation on a monthly basis, women often combine fertility awareness-based methods. These combinations frequently include BBT, cervical mucus tracking, and ovulation predictor test kits.
Tracking cervical mucus
Combining BBT charting and cervical mucus tracking is called the symptothermal method. It boosts the ability to predict ovulation compared to BBT charting alone. It involves examining your cervical mucus, including its consistency, texture, and color every day (Peters, 2021; Perez, 2020; Capotosto, 2020).
Four to seven days before ovulation, cervical mucus changes to make it easier for sperm to make their way to the egg. Just before ovulation, the amount of mucus made by the cervix noticeably increases. The music is then clear, watery, and can be stretched between fingers to a length of at least six centimeters is a sign that you may be ovulating soon. Combining the cervical mucus method with BBT charting increases the chances of accurately predicting ovulation (Peters, 2021).
However, it’s important to be aware that changes in your daily routine could make reading the signs of ovulation, including cervical mucus, more difficult.
Ovulation predictor test kits
Ovulation predictor test kits are designed to predict the day of ovulation and to give couples a chance to plan sex if they are trying to get pregnant.
The tests typically measure hormonal shifts during the menstrual cycle that trigger ovulation, most notably, the surges in hormones called luteinizing hormone (LH) and follicle-stimulating hormone (FSH) (Su, 2017).
While surges vary from woman to woman, typically, about 24–48 hours before ovulation, LH and FSH surge and ovulation occur about 10-12 hours after the highest LH surge (Reed, 2018; Direito, 2013).
And if you’re not science-savvy, don’t worry. These test kits are user-friendly and provide detailed instructions for couples looking to conceive. They also may be a couples’ best option for prediction ovulation when paired with cervical mucus monitoring.
A 2017 study showed that combining cervical mucus observation while monitoring LH levels provides the best accuracy (97%–99%) for those who are self-monitoring. Adding BBT into the mix can help mark the end of the fertile window, but it is less precise (Leiva, 2017).
When should I see a healthcare provider?
Fertility awareness-based methods like BBT offer no protection from sexually transmitted infections (STIs) and are not a good way to prevent pregnancy, so it’s important to talk to your healthcare provider if you’re looking to avoid pregnancy or STIs.
Additionally, predicting when ovulation will take place is complex. There are countless apps and programs that claim to help you predict your most fertile days. The problem with many of these is that they are built on calendar days, and not your specific biology (Bull, 2019; Johnson, 2018).
If you have reason to believe your ovulation cycle may not be regular, talking with a healthcare provider can help you decide if fertility awareness methods will work for you. And if you’ve been trying to get pregnant for a year without success (or for six months if you are over the age of 35), you and your partner may benefit from seeing a fertility specialist identify any potential male or female infertility issues (Leslie, 2021).
Overall, BBT charting is one tool among many. It can’t predict ovulation, but it can help many women better understand their ovulation cycles. If you try BBT charting and don’t see patterns, it may help bring the chart to your healthcare provider, who can help you interpret results and discuss family planning or fertility issues.
DISCLAIMER
If you have any medical questions or concerns, please talk to your healthcare provider. The articles on Health Guide are underpinned by peer-reviewed research and information drawn from medical societies and governmental agencies. However, they are not a substitute for professional medical advice, diagnosis, or treatment.
References
Bull, J. R., Rowland, S. P., Scherwitzl, E. B., Scherwitzl, R., Danielsson, K. G., & Harper, J. (2019). Real-world menstrual cycle characteristics of more than 600,000 menstrual cycles. Npj Digital Medicine , 2 (1). doi: 10.1038/s41746-019-0152-7. Retrieved from https://www.nature.com/articles/s41746-019-0152-7
Direito, A., Bailly, S., Mariani, A., & Ecochard, R. (2013). Relationships between the luteinizing hormone surge and other characteristics of the menstrual cycle in normally ovulating women. Fertility and Sterility , 99 (1). doi: 10.1016/j.fertnstert.2012.08.047. Retrieved from https://www.fertstert.org/article/S0015-0282(12)02135-8/fulltext
Goeckenjan, M., Schiwek, E., & Wimberger, P. (2020). Continuous body temperature monitoring to improve the diagnosis of female infertility. Geburtshilfe Und Frauenheilkunde , 80 (07), 702–712. doi: 10.1055/a-1191-7888. Retrieved from https://www.ncbi.nlm.nih.gov/pmc/articles/PMC7360395/
Johnson, S., Marriott, L., & Zinaman, M. (2018). Can apps and calendar methods predict ovulation with accuracy? Current Medical Research and Opinion , 34 (9), 1587–1594. doi: 10.1080/03007995.2018.1475348. Retrieved from https://www.tandfonline.com/doi/full/10.1080/03007995.2018.1475348
Leiva, R. A., Bouchard, T. P., Abdullah, S. H., & Ecochard, R. (2017). Urinary luteinizing hormone tests: Which concentration threshold best predicts ovulation? Frontiers in Public Health , 5 . doi: 10.3389/fpubh.2017.00320. Retrieved from https://www.frontiersin.org/articles/10.3389/fpubh.2017.00320/full
Leslie, S. W. (2021). Male infertility. [Updated Aug. 12, 2021]. In: StatPearls [Internet]. Retrieved from https://www.ncbi.nlm.nih.gov/books/NBK562258/
Luo, L., She, X., Cao, J., Zhang, Y., Li, Y., & Song, P. X. (2020). Detection and prediction of ovulation from body temperature measured by an in-ear wearable thermometer. IEEE Transactions on Biomedical Engineering , 67 (2), 512–522. doi: 10.1109/tbme.2019.2916823. Retrieved from https://pubmed.ncbi.nlm.nih.gov/31095472/
Manhart, M. D. & Fehring, R. J. (2018). The state of the science of natural family planning fifty years after Humane Vitae: A report from NFP scientists’ meeting held at the US Conference of Catholic Bishops, April 4, 2018. The Linacre Quarterly , 85 (4), 339–347. doi: 10.1177/0024363918809699. Retrieved from https://www.ncbi.nlm.nih.gov/pmc/articles/PMC6322122/
Perez Capotosto, M., & Jurgens, C. Y. (2020). Exploring fertility awareness practices among women seeking pregnancy. Nursing for Women's Health , 24 (6), 413–420. doi: 10.1016/j.nwh.2020.09.002. Retrieved from https://pubmed.ncbi.nlm.nih.gov/33157071/
Peters, A. (2021). Symptothermal contraception. [Updated Nov. 14, 2021]. In: StatPearls [Internet]. Retrieved from https://www.ncbi.nlm.nih.gov/books/NBK564316/
Reed, B. G. (2018). The normal menstrual cycle and the control of ovulation. Endotext . Retrieved from https://pubmed.ncbi.nlm.nih.gov/25905282/
Shilaih, M., Goodale, B. M., Falco, L., Kübler, F., De Clerck, V., & Leeners, B. (2018). Modern fertility awareness methods: Wrist wearables capture the changes in temperature associated with the menstrual cycle. Bioscience Reports , 38 (6). doi: 10.1042/bsr20171279. Retrieved from https://www.ncbi.nlm.nih.gov/pmc/articles/PMC6265623/
Steward, K. (2021). Physiology, ovulation and basal body temperature. [Updated Jul. 22, 2021]. In: StatPearls [Internet]. Retrieved from https://www.ncbi.nlm.nih.gov/books/NBK546686/
Su, H. W., Yi, Y. C., Wei, T. Y., Chang, T. C., & Cheng, C.-M. (2017). Detection of ovulation, a review of currently available methods. Bioengineering & Translational Medicine , 2 (3), 238–246. doi: 10.1002/btm2.10058. Retrieved from https://www.ncbi.nlm.nih.gov/pmc/articles/PMC5689497/
Zhu, T. Y., Rothenbühler, M., Hamvas, G., Hofmann, A., Welter, J. E., Kahr, M., et al. (2021). The accuracy of wrist skin temperature in detecting ovulation compared to basal body temperature: Prospective Comparative Diagnostic Accuracy Study. Journal of Medical Internet Research , 23 (6). doi: 10.2196/20710. Retrieved from https://www.ncbi.nlm.nih.gov/pmc/articles/PMC8238491/


