At Ro, we like to use data when we make decisions about what conditions we can add to our platform that will most benefit patients. We recently noticed that tens of thousands of patients on the platform report suffering from allergic rhinitis, or hay fever. This type of allergy tends to get worse in warmer seasons and makes people stuffy, itchy, and miserable.
We aren’t surprised allergies are so common among our patients — 50 million Americans suffer from them. But when we saw just how prevalent they are on the Ro platform, we wanted to learn more about the current realities of being an allergy sufferer, and if there’s anything we can do to help our patients.
We looked at the available science and data to better understand how allergies are impacting patients on the Ro platform (and everyone else)
When we were finished with our research, three things stood out:
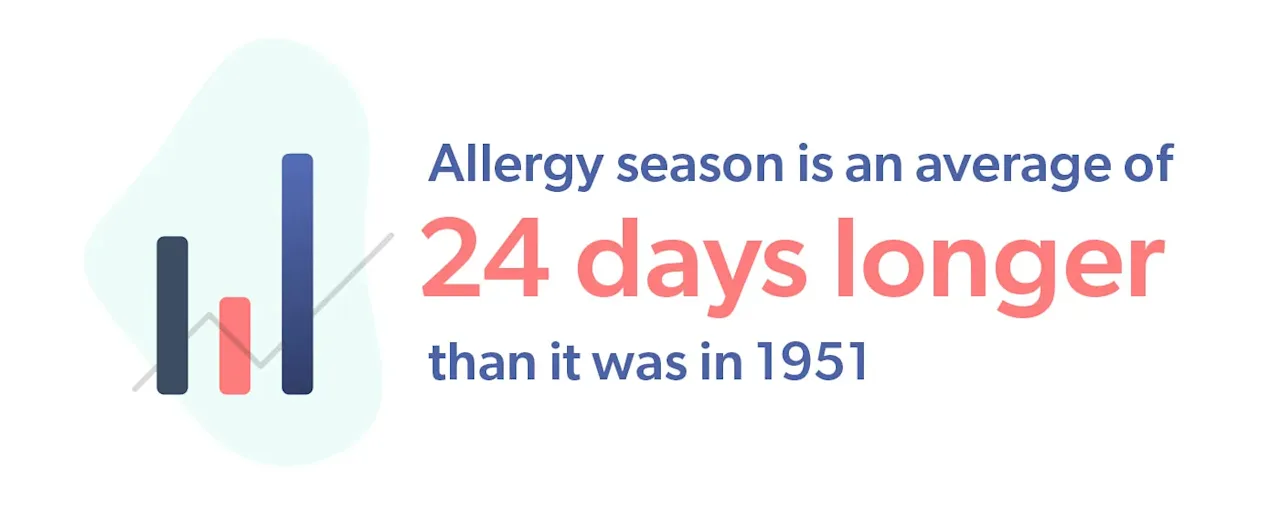
Thanks to climate change, allergies are getting worse: our analysis of temperature data in ten U.S. cities found that allergy season is an average of 24 days longer than it was in 1951
We learned that experts believe air pollution is making allergies worse. When we analyzed patient data to corroborate the science, we found a link: patients on the Ro platform with allergies are more likely to live in counties where air pollution is worse
Specialty care for allergies is scarce for everyone, but can be scarcer depending on where someone lives: 80% of counties have no allergists, and the average rate of allergists to 100,000 people in a county is less than one
Our first key learning: the relationship between climate change and allergies
When we started reading the latest scientific research on allergies, we noticed a lot of it discussed the role of climate change
According to other scientists, warming climates are making allergy season longer
Research shows that levels of pollen are increasing alongside rising temperatures. How? The yearly frost season responsible for killing off grasses, weeds, and other allergy-inducing plants is starting later in the fall and ending earlier in the spring. In other words, frost season is getting shorter and allergy season is getting longer.
We wanted to see climate change’s impact on allergy season for ourselves, so we analyzed and visualized 70 years of daily temperature data
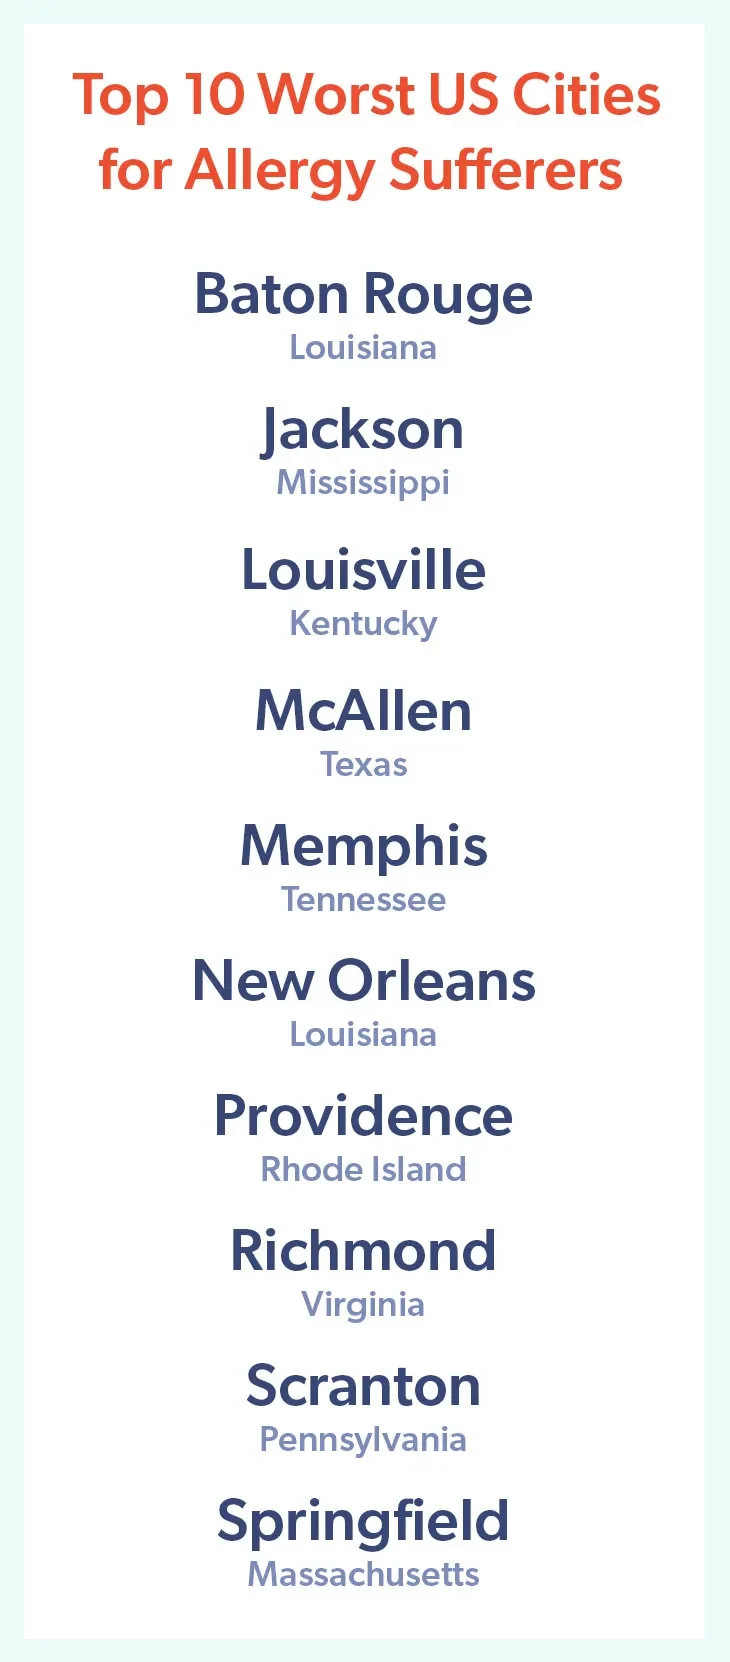
The Asthma and Allergy Foundation of America identified the top ten worst cities for allergy sufferers in 2019. We honed in on these cities and looked into how temperatures are changing over time.
Using 70 years of data from the National Oceanic and Atmospheric Administration (NOAA), we estimated the length of allergy season each year from 1951 through 2019 in each of these cities.
To do this, we needed to create a definition for “allergy season”
We based our definition of allergy season on research showing that pollen counts drop dramatically after the first freeze. With this in mind, we found the first day of the fall season that the minimum temperature was at or below freezing. We then identified the last day the minimum temperature was at or below freezing the following spring. The last freezing day marked the start of warmer weather where plants would start to bloom again.
We counted the number of days in between these frost days and treated that as an approximation of the “frost season” — the time when allergy-triggering plants are less likely to be in bloom. We then subtracted this number from 365 to calculate the estimated length of allergy season — the number of days not in frost season. We did this for each year in each of the ten cities.
We modeled and charted the data, and here’s what it showed:
When we modeled the data, we found that, while there is year-to-year variation, allergy season has increased an average of 24 days in these cities since 1951. These graphs depicting the change in the number of days show that the length of allergy season has increased over time:
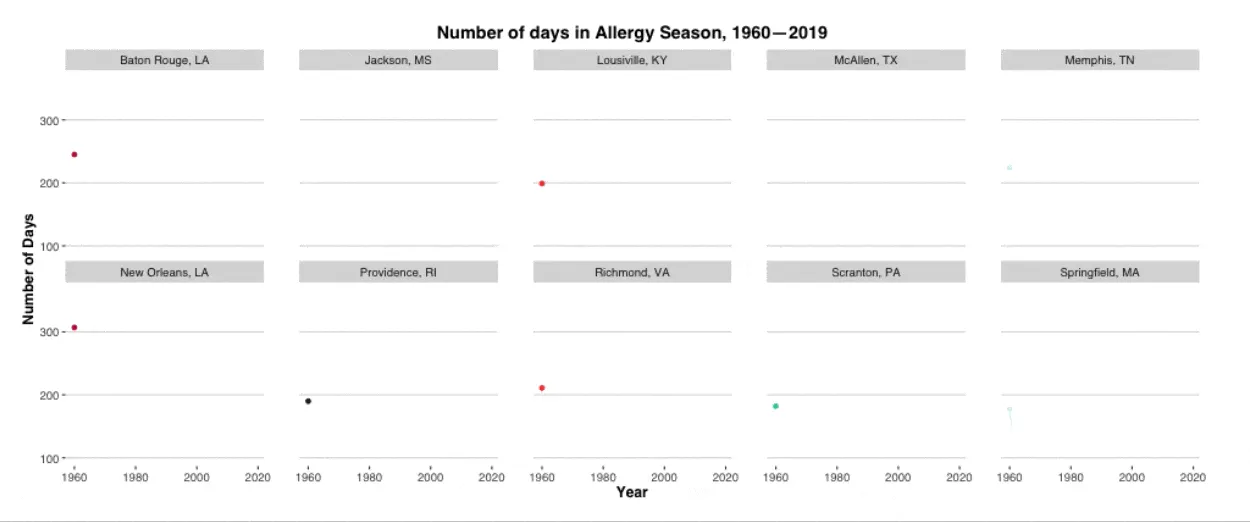
We started the chart at 1960 instead of 1951 because of missing data from the McAllen, Texas weather station
NOAA data isn’t perfect and can be difficult to wrangle, and we want to be transparent about how we accessed and used it. For a detailed explanation of our scraping and analysis methods, click here.

Our second key learning: the relationship between another environmental factor — air pollution — and allergies
It’s not just climate change — air pollution is getting worse, which means so are allergies
We kept reading, and noticed that air pollution was another common theme in the scientific literature on allergies. Researchers have established a link between increased air pollution and worsening allergies, and scientists think air pollution in the United States is also getting worse. Though they aren’t certain why air pollution and allergies are related, they suspect that mixing chemicals from air pollution with airborne allergens like pollen makes those allergens more potent.
We conducted an analysis to see if there was a connection between air pollution and allergies in our patient population. There is.
We wondered whether our patients’ allergies might be related to air pollution where they live, so we conducted an analysis to see if the scientific findings held up. While we can’t be absolutely certain air pollution is making our patients’ allergies worse, we definitely found a connection.
Here’s how we analyzed our data to look for the air pollution and allergies connection:
To do this, we pulled random samples from two groups based on their county of residence: patients that indicated that they suffer from allergic rhinitis and those who reported having no allergies (or only food/medication allergies).
Then, we pulled in county-level air pollution data from the CDC. The data contains a measure known as particulate matter (≤2.5 μm). It’s a count of the amount of small particles in the air that can be inhaled by people. According to the Environmental Protection Agency, most of these particles come from emissions from power plants, industries and automobiles.
Using statistical analysis (specifically, logistic regression), we tested whether the average daily level of air pollution in a county could predict whether a Ro patient reports suffering from allergies. To be sure the relationship would not be confounded by population density, which might affect both how many patients live in a county and how polluted that county is, we controlled for population size.
Here’s what we found:
We found that for every one unit increase in the measure of county-level particulate matter, the odds that a patient living in that county reports suffering from allergic rhinitis increases by 1.2 ( p<.01). Looking at this another way, if you analyze two different cities based on air pollution levels, we can calculate the odds a Ro patient living in one of the 20 most polluted counties has allergic rhinitis is more than ten times greater than the odds that a Ro patient living in one of the 20 least polluted counties has allergic rhinitis.

Our third key learning: The availability of specialty care for allergies in the context of a changing environment
The scientific research and our own analyses on the environment’s role in worsening allergies was convincing, and we believe that more people will likely develop allergic rhinitis and need access to relevant care.
The American College of Allergies, Asthma, and Immunology estimates that the demand for allergy treatment will increase 35% over the next ten years. However, the number of full-time equivalent allergists are on the decline, with only 3,400 projected to be practicing in 2020 — in a country where an estimated 50 million people have allergic rhinitis. Though mild cases can be managed in a primary care setting, patients with chronic and/or moderate-to-severe allergies will likely lack access to specialty care that could be beneficial for them.
We analyzed the number and practice locations of allergists in the U.S. and found that the shortage is notable and geographical care gaps are evident.
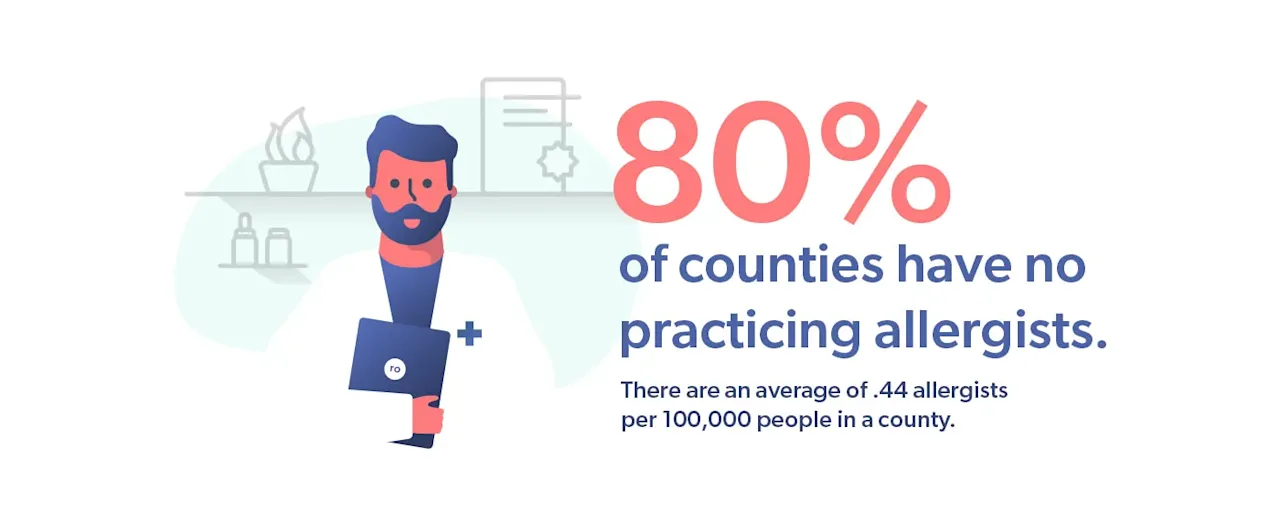
To determine the extent of the allergist shortage, we combined provider practice data from the Centers for Medicare and Medicaid and census population estimates. We filtered the provider practice data for anyone identified as an allergist, and then used the address of their practice location to determine the county where they operate. Then, using county-level census data, we calculated the rate of available allergists per 100,000 people in that county. Eighty percent of counties have no practicing allergists, and there are an average of 0.44 allergists per 100,000 people in a county.

We also visualized the relationship between the availability of allergists and the impact of the environment across the United States to possible show the gaps in specialty care
We visualized the data to see if allergists are practicing in areas where the environment is wreaking the most havoc in two ways. First, we overlaid the county-level rate of rate allergists per 100,000 residents on top of the most recently available county-level data measuring the number of particles (pollution) in the air. On a second map, we overlaid the county-level rate of rate allergists per 100,000 residents on top of county-level data measuring which counties have warmed the most over the last century. Specifically, we looked at the change in the monthly average temperature for October because our other analysis showed that the first fall frost day commonly occurred during that month.
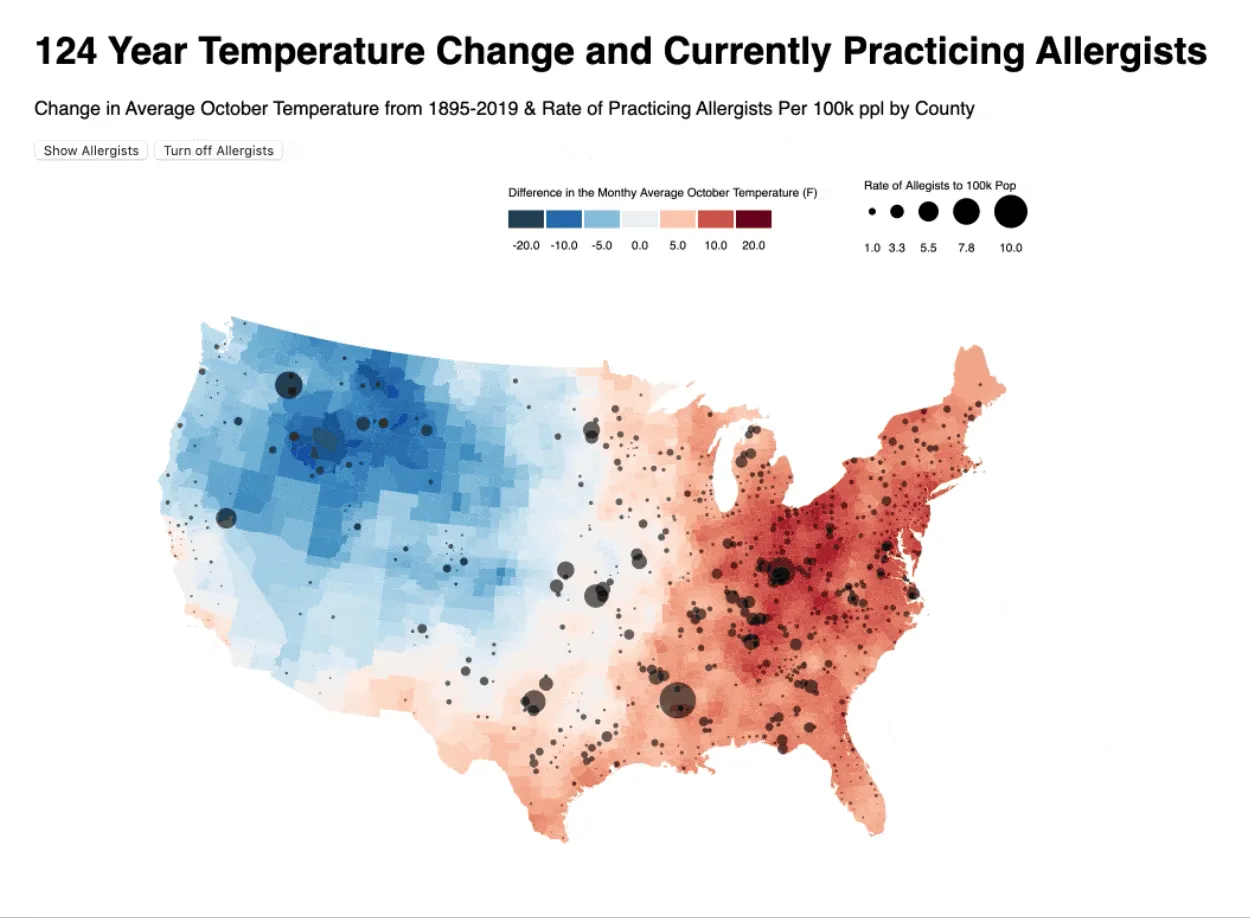
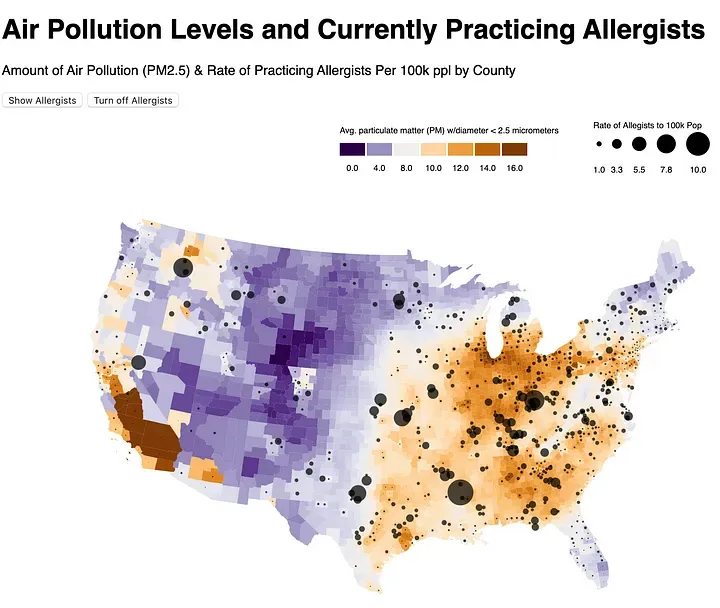
These maps are interactive! To check them out, click here and here.
Together, the maps show that while some allergists are concentrated in some polluted and/or warming areas, some people might be without the access to care they need.
It’s important to acknowledge the data that we used here has flaws. It doesn’t capture board certified allergists that aren’t ‘full-time equivalent’. The CMS data would also exclude any allergists that do not accept Medicare. This means that we are probably underestimating the amount of available allergy providers. We also know that Primary Care Physicians and Ear, Nose, and Throat specialists can treat allergies and can help fill these access gaps. But research (including some of our own) shows that it can be a challenge for some to access these providers, too.
Our main takeaway from all this research? Making allergy treatment available on our platform will help our patients get access to allergy care no matter where they are
We’d prefer if there was less air pollution and that global temperatures stopped rising, but we know that can’t happen overnight. In the meantime, we want to provide convenient access to doctor-prescribed allergy treatment plans for anyone who needs it.
Our mission is for telemedicine to democratize healthcare, and offering treatment for allergies is no exception. We believe our platform can help patients who live in the places hardest hit by allergy-triggering environmental change and who also have greatest challenges for access to care.
Environmental change aside, people everywhere suffer from allergies. Offering access to high-quality allergy care via telemedicine can help everyone, no matter where they live.
